Local and Global Weather Currents
September 02, 06 by
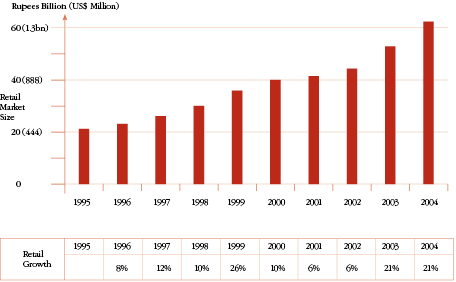
De Beers believes sales in India’s domestic diamond jewelry market have exceeded $1.65 billion a year - growing at a 2-digit level annually. As the emerging affluent middle class buy quality goods, the diamond content in the jewelry is high, assumed at 70 percent in polished wholesale values. Thus polished diamond sales to Indian consumers are well above $1 billion.
It is estimated that at least 50 percent of domestic sales by value (and two-thirds by volume) consist of polished stones manufactured in India.
One Indian industry leader noted that “nobody really knows the real size of the present domestic market for diamonds and/or diamond jewelry – and any figure entioned will probably still be understating the position.”
The possession of diamond or gold jewelry is highly treasured by the people of India, and the culture ‘invites’ jewelry use. Imported loose polished diamonds were until recently subject to a 15 percent import duty. Together with the sales tax, polished diamond imports used to cost an additional 22 percent. Not surprisingly, hardly any such imports were recorded in the past. In 2002, all import restrictions were abolished. Currently there is a free movement of goods for both rough and polished.
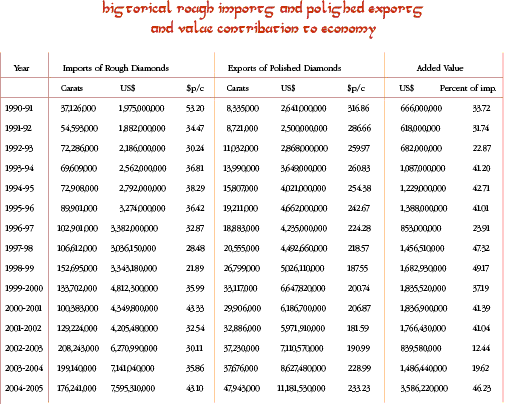
The industry’s strategic planners consider it unlikely that the Indian diamond sector will be able to significantly increase its worldwide market share in diamonds and, accordingly, industry leaders are seeking further value-added growth through vertical integration. Exports of diamond-set jewelry are being encouraged. In the past five years, India has succeeded in its carefully planned diversification through the establishment of jewelry manufacturing units in free trade zones (Export Processing Zones – EPZ).
Export Markets
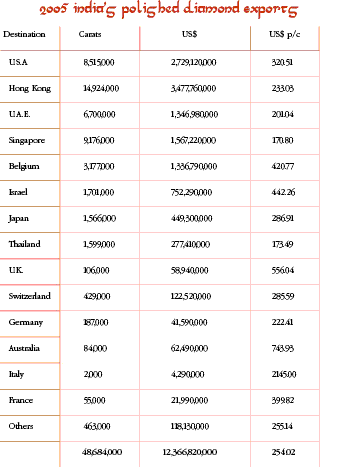
About 13 countries represent 96 percent of India’s export destinations, with the U.S. the single most important (22 percent in 2005), followed by Hong Kong, Dubai, Singapore, Belgium, and Israel. [Five years ago, by value, the United States was also first (36 percent), followed by Hong Kong (26 percent), Belgium (13 percent) and Japan (7 percent).] This underscores the trend towards exporting to intermediate destinations, from which the goods are further distributed. This is related both to transfer pricing and availability of finance.
| 
|
Diamonds and jewelry exports totaled $17.78 billion in the 2005 calendar year, of which polished diamonds accounted for 73 percent and gold studded and diamond-set jewelry for 22 percent. The remaining 5 percent was colored gemstones. “India contributes less than 4 percent of the world’s $60 billion plus diamond jewelry,” says a leading diamond and jewelry manufacturer, underscoring that the greatest opportunities are in diamond-set jewelry, rather than in polished diamond manufacturing.
In 2006, we have seen a sudden shift in the U.S. market in which India’s market share increased dramatically at the expense of Israeli and Belgian suppliers. The only thing that “changed” on January 1, 2006, was the implementation of the U.S. Anti-Money Laundering (AML) and Anti-Terrorist Financing (CFT) “Jewelry Rule”, which requires, among other things, retailers to implement an AML/CFT program, unless they purchase only from domestic U.S. parties, which have instituted a program.
The Indian diamond and jewelry industry has some 3,000 offices around the world and 1,250 in the United States alone. Suddenly, the much feared FinCEN AML/CFT Jewelry Rule, which clearly discriminates against foreign suppliers, has turned out to be an advantage for the Indian industry. They have already a U.S. presence and so their sales to retailers are not viewed as sales from foreign suppliers. Below are some U.S. polished diamond import pictures, which include the January-April 2006 data. This is the latest information available from the U.S. government as of June 2006. These figures show:
*The sudden trend in which local offices of the Indians were able to take market share away from Israelis and Belgians. Indian players were able to “take off” in larger goods (conceivably bought in Israel) and to expand sales of larger goods into the United States by 24 percent. Israel grew only by 8.5 percent, while Belgium faced a decline of 1.1 percent.
*In all sizes together, U.S. diamond imports (by value) went up by 12.1 percent. Israel’s share of the growth declined to merely 7.3 percent, while India grew by 18.4 percent. Imports from Belgium declined by 2 percent.
*Until January 2006, Belgium and Israel had a small niche of smaller goods (below 0.5 carat) in the better categories. It is suddenly losing that market segment. India increased its exports by 14.4 percent, while Israel declined by 10.8 percent and Belgium by 12.1 percent.
These conclusions are based on only four months of U.S. imports -though the trend, and the reasons for it, was also confirmed by the Indian representative at the World Diamond Congress in Tel Aviv. The market share of India in its principal market is bound to increase because of the country’s many representatives in the U.S. market. There is an irony here that AML/CFT diamond industry rules, which have yet to be imposed in India while Belgium and Israel have already a regime in place, are enabling India to increase exports to the United States.


